SUM Command
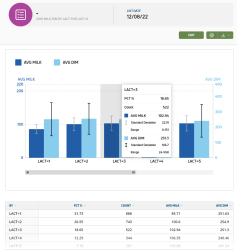
A SUM report
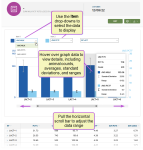
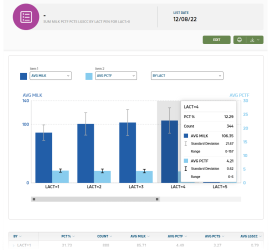
- Animal counts
- Average values
- Standard deviation
 A measure that is used to quantify the amount of variation or dispersion of a set of data values.
- Data range details, including minimum and maximum values
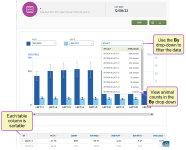
The graph view is flexible and can be adjusted on the fly.
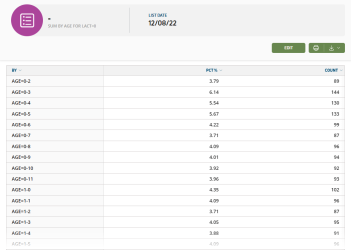
Additionally, each of the table columns allows for sorting to quickly customize your data view.
See the following SUM command examples:
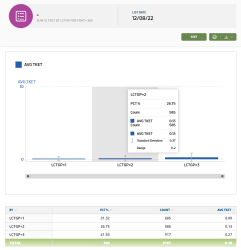
SUM \Z TKET BY LCTGP FOR FDAT>-365
NOTE: The use of the \Z switch results in the inclusion of zero values for TKET, which includes all animals, not only those diagnosed with ketosis Ketosis is a common ailment that usually occurs in early lactation, when the energy demands of milk production are very high and the cow metabolizes fat stores for energy. Symptoms of ketosis may include reduced milk yield, weight loss, reduced appetite, acetone smell of breath and/or milk, and fever.. Removing the switch only includes animals with TKET values, which leads to higher TKET averages.
Last Built: November 11, 2025
