Cows
To use this feature, your VAS PULSE Platform user account must be assigned to a Role with Herd Configuration permissions. See Edit Dairy User Permissions and Manage Dairy Roles for more information.
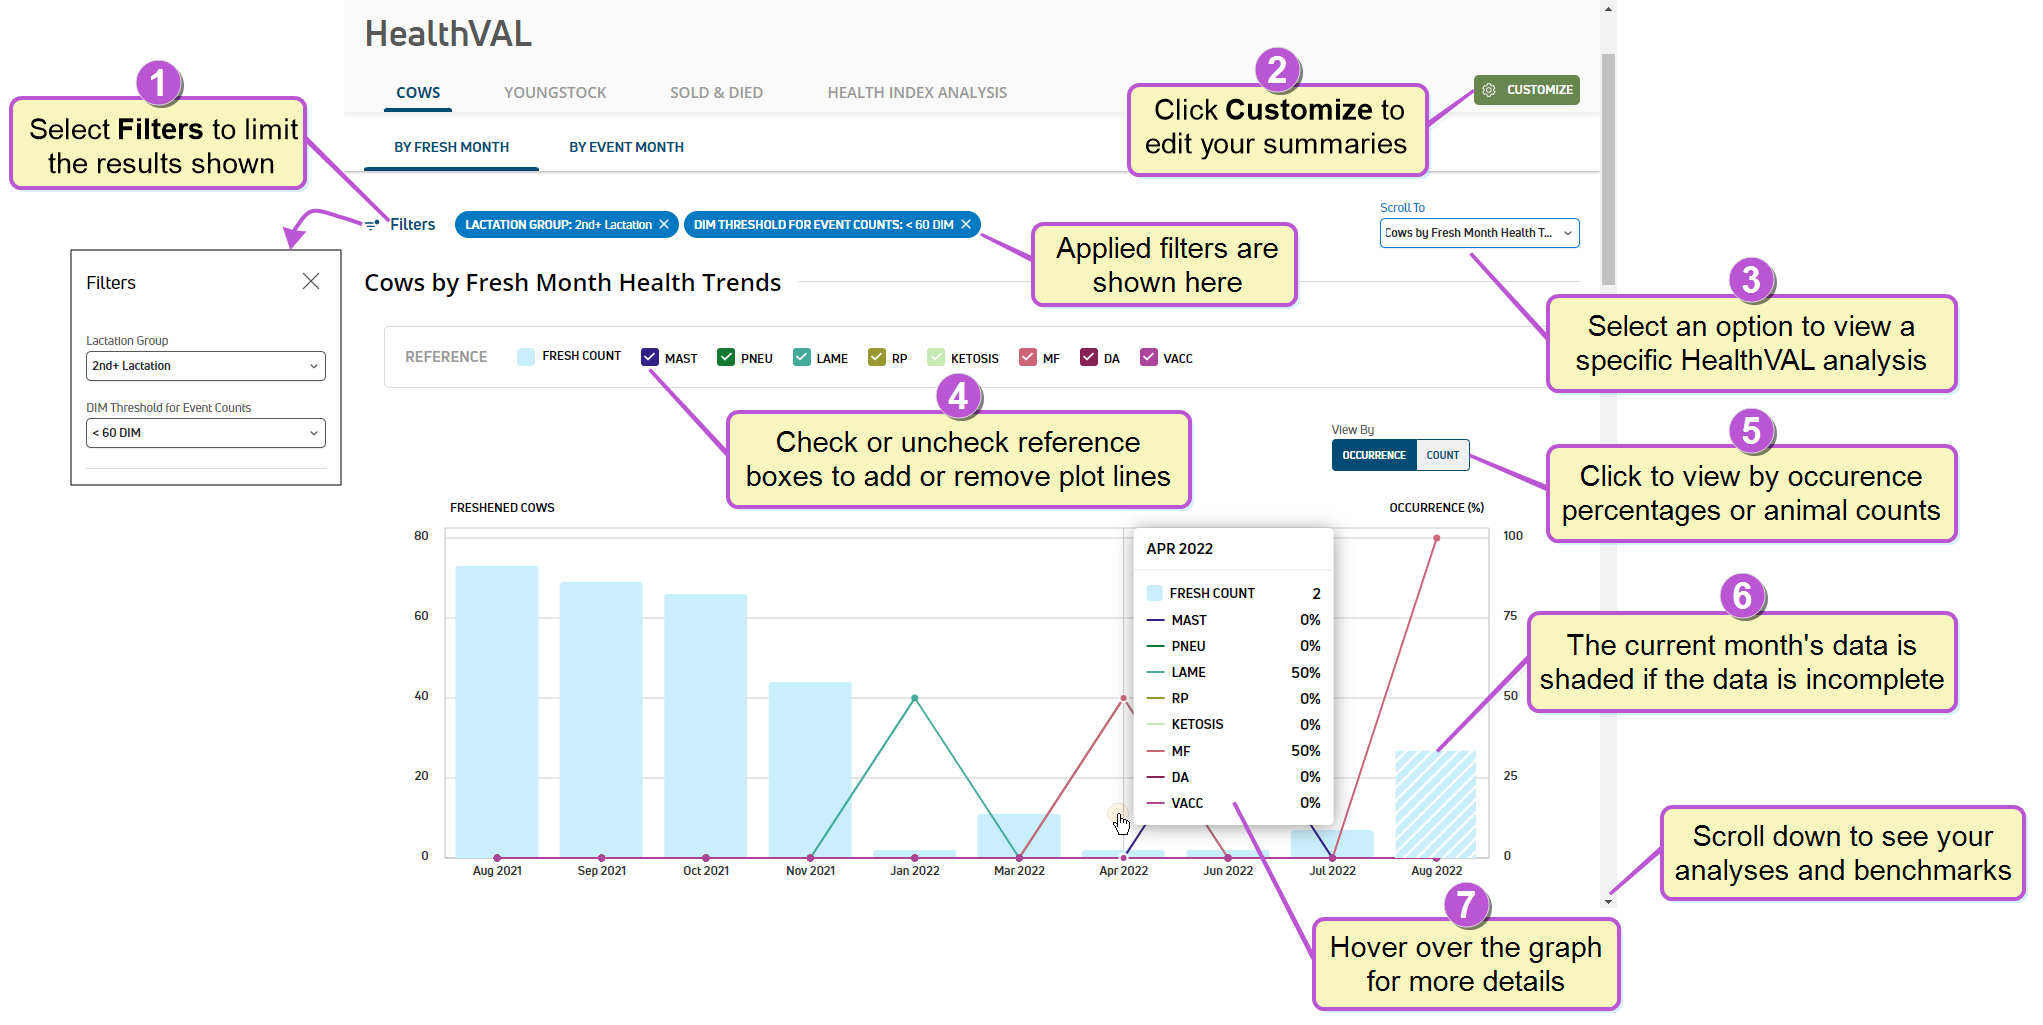
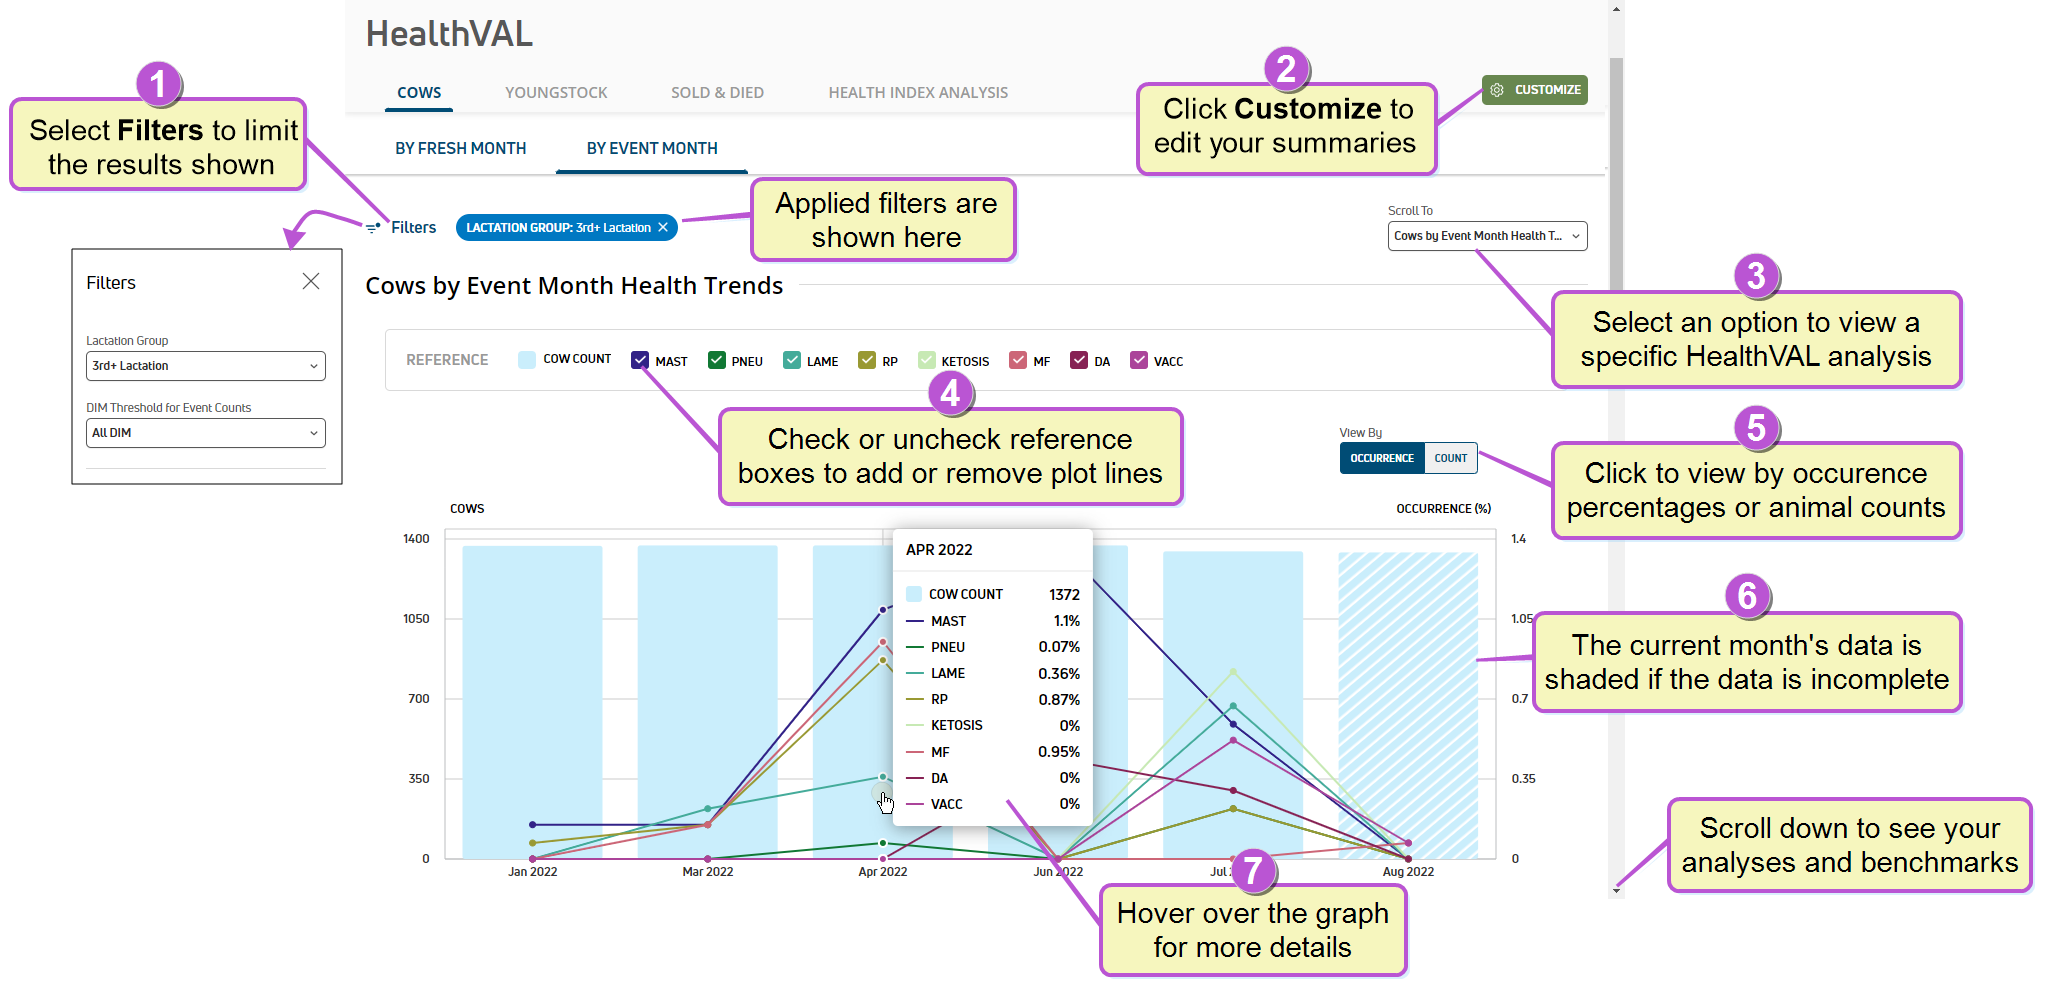
Use the Cows tab for an overview of your cow health events, so you can quickly note any unexpected changes in case counts. Cow Health Trends can be viewed in the distinct groupings below.
By Fresh Month: Monthly health event data for all cows by month fresh.
By Event Month: Monthly health event data for all cows.
See the topics below to learn more:
- Select Filters to open a side panel on the left of the page to filter the list of lactation events and/or DIM
 Days in milk thresholds for event counts. Once a filter is selected, the current filter applied is displayed next to the Filters option. Click the X on a specific filter to remove it.
 - Click the Customize button to edit your HealthVAL summaries for cow and heifer events and/or modify your HealthVAL benchmark settings.
- Use the Scroll To shortcut to further analyze individual events in the graphs below. See Cow Event Analysis to learn more about analyzing specific events.
- Reference checkboxes allow you to control which lines are plotted on the graph. Each reference is color-coded to match a specific bar or line on the graph.
- Click Occurrence to view the reference data in occurrence percentages and include threshold values on the graph, or click Count to view the reference data in total counts.
- If the graph includes data for the current month, the bar is shaded to indicate that data for the month is incomplete.
- Hover over a bar on the graph to view additional data.
Last Built: November 11, 2025